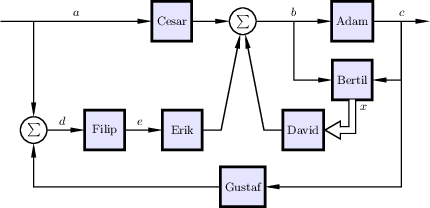
|
Size: 19156
Comment:
|
Size: 7521
Comment: basic feedforward, ff0
|
| Deletions are marked like this. | Additions are marked like this. |
| Line 1: | Line 1: |
| ## page was renamed from Computer/Latex/BlockDiagrams ## page was renamed from BlockDiagrams ## page was renamed from BlockDiagrams2 ## page was copied from BlockDiagrams #acl Known:read,write,admin,delete,revert All:read |
|
| Line 6: | Line 12: |
| This warning will be removed once all [[computerBlockDiagram|Anton's eps block diagrams]] have been ported to [[http://www.ctan.org/pkg/pgf|TikZ]]. Feel free to contribute. | This warning will be removed once all [[Computer/Latex/BlockDiagram|Anton's eps block diagrams]] have been ported to [[http://www.ctan.org/pkg/pgf|TikZ]]. Feel free to contribute. |
| Line 11: | Line 17: |
| [[https://www.control.lth.se/Staff/AntonCervin.html|Anton]] created a [[computerBlockDiagram|set of block diagrams]] in ps format, where text elements can be changed using {{{\psfrag}}} in LaTeX. This page provides ports of these block diagrams to TikZ. The reason for creating these ports were: | [[http://www.control.lth.se/Staff/Anton-Cervin|Anton]] created a [[Computer/Latex/BlockDiagram|set of block diagrams]] in ps format, where text elements can be changed using {{{\psfrag}}} in LaTeX. This page provides ports of these block diagrams to TikZ. The reason for creating these ports were: |
| Line 25: | Line 31: |
| \usetikzlibrary{shapes,positioning} | |
| Line 26: | Line 33: |
| \tikzset{>=narrow} | |
| Line 32: | Line 39: |
| \begin{tikzpicture} \small \tikzstyle{block} = [draw,rectangle,minimum size=8mm,node distance=25mm] \tikzstyle{sum} = [draw, circle,node distance=8mm,inner sep=0mm,minimum size=4mm] |
\begin{tikzpicture}[auto, line width=1pt, >=narrow] \tikzset{block/.style={draw, rectangle, line width=2pt, minimum height=3em, minimum width=3em, outer sep=0pt}} \tikzset{sumcircle/.style={draw, circle, outer sep=0pt, label=center:{$\sum$}, minimum width=2em}} |
| Line 37: | Line 44: |
| \node[block,below of=G1,yshift=10mm](G2){$G_2$}; \node[sum,left of=G1,xshift=-3mm](s){$s$}; \node[coordinate,left of=s](input){}; \node[coordinate,right of=G1,xshift=6mm](output){}; \draw[->](input)--node[above,near start](){$R$}(s); \draw[->](s)--(G1); \draw[->](G1)--node[above,near end](){$Y$}(output); \draw[->]([xshift=5mm]G1.east)|-(G2); \draw[->](G2)-|(s); |
\node[block,below=6mm of G1](G2){$G_2$}; \node[sumcircle,left=7mm of G1](sum){}; \node[coordinate,left=13mm of sum](input){}; \node[coordinate,right=13mm of G1](output){}; \draw[->](input)--node[xshift=-2mm]{$R$}(sum); \draw[->](sum)--(G1); \draw[->](G1)--node(y)[]{$Y$}(output); \draw[->](y)|-(G2){}; \draw[->](G2)-|(sum); |
| Line 47: | Line 55: |
| % | |
| Line 54: | Line 61: |
| [[attachment:feedback0.pdf|{{attachment:feedback0.png}}|target=blank_]] If you think the TikZ code ({{{\begin{tikzpicture}}} to {{{\end{tikzpicture}}}}) clutters the .tex file, it can be placed in a separate file, e,g. {{{mypicture.tikz}}}, and inserted in the .tex file using the the command {{{\input{mypicture.tikz}}}}, which simply places the content of {{{mypicture.tikz}}} at the location of the commend. The arrow style {{{>=narrow}}} is local to the department. If you do not have access to it on your computer, you may use {{{>=latex}}} instead, or download the file defining the style; [[attachment:Matlab2tikz/tikzlibrarynarrow.code.tex| |&do=get]]. |
[[attachment:firsttikz.pdf|{{attachment:feedback0.png}}|&do=get]] If you think the TikZ code ({{{\begin{tikzpicture}}} to {{{\end{tikzpicture}}}}) clutters the .tex file, it can be placed in a separate file, e,g. {{{mypicture.tikz}}}, and inserted in the .tex file using the the command {{{\input{mypicture.tikz}}}}, which simply places the content of {{{mypicture.tikz}}} at the location of the command. A further improvement is to use the {{{standalone}}} class and package to create the pictures and to insert them into the main document. All block diagram examples below are created with the {{{standalone}}} class, and the main document to include them would be (same example as above): {{{ \documentclass{pm} \usepackage{standalone} \usepackage{tikz} \usetikzlibrary{shapes,positioning} \usetikzlibrary{narrow} \begin{document} Figure~\ref{fig:blocks} shows an example block diagram. \begin{figure} \centering \input{feedback0.tikz} \end{figure} \end{document} }}} The arrow style {{{>=narrow}}} is local to the department. If you do not have access to it on your computer, you may use {{{>=latex}}} instead, or download the file defining the style; [[attachment:Matlab2tikz/tikzlibrarynarrow.code.tex| |&do=get]] (or http://dist.control.lth.se/public/Texlive/texmf-local/tex/latex/tikzlibrarynarrow.code.tex ). |
| Line 73: | Line 96: |
| {{{ \begin{tikzpicture}[scale=0.6, transform shape] }}} The above scales everything. |
|
| Line 81: | Line 109: |
| The figures below are links to separate pages with complete source code and some relevant comments for each figure. (They will be, it is still work in progress /Leif) | |
| Line 85: | Line 114: |
| [[attachment:feedback0.pdf|{{attachment:feedback0.png}}|target=blank_]] {{{ \begin{tikzpicture} \small \tikzstyle{block} = [draw, rectangle,minimum size=8mm,node distance=25mm] \tikzstyle{sum} = [draw,circle,node distance=8mm,inner sep=0mm,minimum size=4mm] \node[block](G1){$G_1$}; \node[block,below of=G1,yshift=10mm](G2){$G_2$}; \node[sum,left of=G1,xshift=-3mm](s){$s$}; \node[coordinate,left of=s](input){}; \node[coordinate,right of=G1,xshift=6mm](output){}; \draw[->](input)--node[above,near start](){$R$}(s); \draw[->](s)--(G1); \draw[->](G1)--node[above,near end](){$Y$}(output); \draw[->]([xshift=5mm]G1.east)|-(G2); \draw[->](G2)-|(s); \end{tikzpicture} }}} |
[[/feedback0_tikz|{{attachment:feedback0.png}}]] |
| Line 105: | Line 117: |
| [[attachment:feedback1.pdf|{{attachment:feedback1.png}}|target=blank_]] {{{ \begin{tikzpicture} \small \tikzstyle{block} = [draw, rectangle,minimum size=8mm,node distance=25mm] \tikzstyle{sum} = [draw,circle,node distance=8mm,inner sep=0mm,minimum size=4mm] \node[block](G1){$G_1$}; \node[block,right of=G1,xshift=-6mm](G2){$G_2$}; \draw[->](G1)--node[above](U){$U$}(G2); \node[block,below of=U,yshift=10mm](G3){$G_3$}; \node[sum,left of=G1,xshift=-6mm](s){$s$}; \node[coordinate,left of=s](input){}; \node[coordinate,right of=G2,xshift=6mm](output){}; \draw[->](input)--node[above,near start](){$R$}(s); \draw[->](s)--node[above](){$E$}(G1); \draw[->](G2)--node[above,near end](){$Y$}(output); \draw[->]([xshift=5mm]G2.east)|-(G3); \draw[->](G3)-|(s); \end{tikzpicture} }}} |
[[/feedback1_tikz|{{attachment:feedback1.png}}]] |
| Line 126: | Line 120: |
| [[attachment:feedback1b.pdf|{{attachment:feedback1b.png}}|target=blank_]] {{{ \begin{tikzpicture} \small \tikzstyle{block} = [draw, rectangle,minimum size=8mm,node distance=25mm] \tikzstyle{sum} = [draw,circle,node distance=8mm,inner sep=0mm,minimum size=4mm] \node[block](G1){$G_1$}; \node[block,right of=G1,xshift=-6mm](G2){$G_2$}; \draw[->](G1)--node[above](U){$U$}(G2); \node[block,below of=U,yshift=10mm](G3){$G_3$}; \node[sum,left of=G1,xshift=-6mm](s){$s$}; \node[coordinate,left of=s](input){}; \node[coordinate,right of=G2,xshift=6mm](output){}; \draw[->](input)--node[above,near start](){$R$}(s); \draw[->](s)--node[above](){$E$}(G1); \draw[->](G2)--node[above,near end](){$Y$}(output); \draw[->]([xshift=5mm]G2.east)|-(G3); \draw[->](G3)-|(s); \node[coordinate,above of=G2,yshift=2mm](input2){}; \draw[->](input2)--node[right,near start](){$V$}(G2); \end{tikzpicture} }}} |
[[/feedback1b_tikz|{{attachment:feedback1b.png}}]] |
| Line 149: | Line 123: |
| [[attachment:feedback1c.pdf|{{attachment:feedback1c.png}}|target=blank_]] {{{ \begin{tikzpicture} \small \tikzstyle{block} = [draw,rectangle,minimum size=8mm,node distance=25mm] \tikzstyle{sum} = [draw,circle,node distance=8mm,inner sep=0mm,minimum size=4mm] \node[block](G1){$G_1$}; \node[block,right of=G1,xshift=-6mm](G2){$G_2$}; \draw[->](G1)--node[above](U){$U$}(G2); \node[draw,rectangle,below of=U](G3){$G_3$}; \node[sum,left of=G1,xshift=-6mm](s){$s$}; \node[coordinate,left of=s](input){}; \node[coordinate,right of=G2,xshift=6mm](output){}; \draw[->](input)--node[above,near start](){$R$}(s); \draw[->](s)--node[above](){$E$}(G1); \draw[->](G2)--node[above,near end](){$Y$}(output); \draw[->]([xshift=5mm]G2.east)|-(G3); \draw[->](G3)-|(s); \end{tikzpicture} }}} |
|
| Line 171: | Line 125: |
| [[attachment:feedback1d.pdf|{{attachment:feedback1d.png}}|target=blank_]] {{{ \begin{tikzpicture} \small \tikzstyle{block} = [draw,rectangle,minimum size=8mm,node distance=25mm] \tikzstyle{sum} = [draw,circle,node distance=8mm,inner sep=0mm,minimum size=4mm] \node[block](G1){$G_1$}; \node[sum,left of=G1,xshift=-4mm](s){$s$}; \node[sum,right of=G1,xshift=4mm](s2){$s$}; \node[block,right of=s2,xshift=-12mm](G2){$G_2$}; \draw[->](G1)--(s2); \draw[->](s2)--(G2); \node[draw,rectangle,below of=s2](G3){$G_3$}; \node[coordinate,left of=s,xshift=-4mm](input){}; \node[coordinate,right of=G2,xshift=6mm](output){}; \draw[->](input)--node[above,near start](){$R$}(s); \draw[->](s)--(G1); \draw[->](G2)--node[above,near end](){$Y$}(output); \draw[->]([xshift=5mm]G2.east)|-(G3); \draw[->](G3)-|(s); \node[block,above of=G1,yshift=-12mm](G4){$G_4$}; \draw[->](G4)-|(s2); \draw[->]([xshift=-4mm]s.west)|-(G4); \end{tikzpicture} }}} |
[[/feedback1d_tikz|{{attachment:feedback1d.png}}]] |
| Line 198: | Line 128: |
| [[attachment:feedback1e.pdf|{{attachment:feedback1e.png}}|target=blank_]] {{{ \begin{tikzpicture} \small \tikzstyle{block} = [draw, rectangle,minimum size=8mm,node distance=25mm] \tikzstyle{sum} = [draw,circle,node distance=8mm,inner sep=0mm,minimum size=4mm] \node[block](G1){$G_1$}; \node[block,right of=G1,xshift=-6mm](G2){$G_2$}; \draw[->](G1)--node[above](U){}(G2); \node[block,below of=U,yshift=10mm](G3){$G_3$}; \node[coordinate,right of=G2,xshift=6mm](output){}; \draw[->](G2)--node[above,near end](){}(output); \draw[->]([xshift=5mm]G2.east)|-(G3); \node[coordinate,left of=G1](turn){}; \draw[->](G3)-|(turn)--(G1); \end{tikzpicture} }}} |
|
| Line 216: | Line 130: |
| [[attachment:feedback2.png|{{attachment:feedback2.png}}|target=blank_]] {{{ \begin{tikzpicture} \small %\draw[help lines] (-30mm,-20mm) grid (50mm,15mm); \tikzstyle{block} = [draw,rectangle,minimum size=8mm,node distance=25mm] \tikzstyle{sum} = [draw,circle,node distance=8mm,inner sep=0mm,minimum size=4mm] \node[block](G1){$G_1$}; \node[sum,left of=G1,xshift=-6mm](s){$+$}; \node[sum,right of=G1,xshift=6mm](s2){$+$}; \node[block,right of=s2,xshift=-12mm](G2){$G_2$}; \draw[->](G1)--node[above](U){$U$}(s2); \draw[->](s2)--(G2); \node[draw,rectangle,below of=s2](G3){$G_3$}; \node[coordinate,left of=s,xshift=-4mm](input){}; \node[coordinate,right of=G2,xshift=6mm](output){}; \draw[->](input)--node[above,near start](){$R$}(s); \draw[->](s)--node[above](){$E$}(G1); \draw[->](G2)--node[above,near end](){$Y$}(output); \draw[->]([xshift=5mm]G2.east)|-(G3); \draw[->](G3)-|(s); \node[coordinate,above of=s2,xshift=0mm](inputV){}; \node [below right] at (inputV){$V$}; \draw[->](inputV)-|(s2); \end{tikzpicture} }}} |
[[/feedback2_tikz|{{attachment:feedback2.png}}]] |
| Line 263: | Line 154: |
| [[/cascade1_tikz|{{attachment:cascade1.png}}]] | |
| Line 268: | Line 160: |
| ==== ff0 ==== [[/ff0_tex|{{attachment:ff0.png}}]] |
|
| Line 271: | Line 166: |
| [[/fbff2_tex|{{attachment:fbff2.png}}]] | |
| Line 275: | Line 171: |
| [[attachment:ffss.pdf|{{attachment:ffss.png}}|target=blank_]] {{{ \begin{tikzpicture} \small \tikzstyle{block} = [draw,rectangle,minimum size=8mm,node distance=25mm] \tikzstyle{sum} = [draw, circle,node distance=8mm,inner sep=0mm,minimum size=4mm] \node[draw,rectangle,minimum width=2cm,minimum height=16mm](GM){$G_M$}; \node[coordinate,left of=GM,xshift=-2cm](input){}; \draw[->](input)--node[above,near start](){$R$}(GM); \node[sum,right of=GM,xshift=14mm,yshift=-5mm](s1){$s$}; \draw[->]([yshift=-5mm]GM.east)--node[above](){$X_M$}(s1); \node[block,right of=s1,xshift=-14mm](C){$C$}; \draw[->](s1)--(C); \node[sum,right of=C,xshift=4mm](s2){$s$}; \draw[->](C)--(s2); \draw[->]([yshift=5mm]GM.east)-|node[above](){$U_F$}(s2); \node[block,right of=s2,xshift=-10mm](P){$P$};¶ \draw[->](s2)--(P); \node[coordinate,right of=P,xshift=4mm](output){}; \draw[->](P)--node[above,near end](){$Y$}(output); \node[block,below of=C,yshift=10mm](M){$M$}; \draw[->]([xshift=3mm]s2.east)|-([yshift=2mm]M.east); \draw[->]([xshift=3mm]P.east)|-([yshift=-2mm]M.east); \draw[->](M)-|node[above,near start](){$X_H$}node[left,at end,yshift=-2mm](){$-$}(s1); \draw[-]([xshift=2mm,yshift=2mm]P.center)--node[above, at end,xshift=1mm](){$X$}([xshift=6mm,yshift=8mm]P.center); \end{tikzpicture} }}} |
[[/ffss_tex|{{attachment:ffss.png}}]] |
| Line 308: | Line 176: |
| [[attachment:smith1.pdf|{{attachment:smith1.png}}|target=blank_]] {{{ \begin{tikzpicture} \small \tikzstyle{block} = [draw,rectangle,minimum size=8mm,node distance=25mm] \tikzstyle{sum} = [draw, circle,node distance=8mm,inner sep=0mm,minimum size=4mm] \node[sum](s1){$s$}; \node[coordinate,left of=s1](input){}; \draw[->](input)--node[above,near start](){$R$}(s1); \node[block,right of=s1,xshift=-12mm](G1){$G_1$}; \draw[->](s1)--(G1); \node[block,right of=G1,xshift=-4mm](G2){$G_2$}; \draw[->](G1)--node[above](){$U$}(G2); \node[block,below of=G2,yshift=14mm](G3){$G_3$}; \node[block,below of=G3,yshift=14mm](G4){$G_4$}; \draw[->]([xshift=6mm]G1.east)|-(G3); \draw[->]([xshift=6mm]G1.east)|-(G4); \node[sum,right of=G3,xshift=8mm](s2){$s$}; \draw[->](G2.east)--node[above,at start,xshift=3mm](){$Y$}([xshift=6mm]G2.east)--(s2); \draw[->](G3)--node[above,at start,xshift=3mm](){$Y_1$}node[above,near end](){$-$}(s2); \draw[->](G4.east)--node[above,at start,xshift=3mm](){$Y_2$}([xshift=6mm]G4.east)--(s2); \draw[->](s2.east)--([xshift=4mm]s2.east)|-([yshift=-28mm]s1.south)--node[left,at end,yshift=-2mm](){$-$}(s1.south); \end{tikzpicture} }}} |
[[/smith1_tikz|{{attachment:smith1.png}}]] |
| Line 334: | Line 179: |
| [[attachment:smith2.pdf|{{attachment:smith2.png}}|target=blank_]] {{{ \begin{tikzpicture} \small \tikzstyle{block} = [draw,rectangle,minimum size=8mm,node distance=25mm] \tikzstyle{sum} = [draw, circle,node distance=8mm,inner sep=0mm,minimum size=4mm] \node[sum](s1){$s$}; \node[coordinate,left of=s1](input){}; \draw[->](input)--node[above,near start](){$R$}(s1); \node[sum,right of=s1,xshift=8mm](s2){$s$}; \draw[->](s1)--node[above,near start](){$E$}(s2); \node[block,right of=s2,xshift=-14mm](G1){$G_1$}; \draw[->](s2)--(G1); \node[block,below of=G1,yshift=12mm](G3){$G_3$}; \draw[->](G3)-|(s2); \node[block,right of=G1,xshift=-4mm](G2){$G_2$}; \draw[->](G1)--node[above,xshift=-2mm](){$U$}(G2); \draw[->]([xshift=4mm]G1.east)|-(G3); \draw[dashed]([xshift=-18mm,yshift=-6mm]G3) rectangle ([xshift=12mm,yshift=6mm]G1); \node[rectangle,above of=G1,xshift=-4mm,yshift=-2mm](){$C$}; \node[coordinate,right of=G2,xshift=2mm](output){}; \draw[->](G2)--node[above,near end](){$Y$}(output); \node[block,below of=G3,yshift=10mm](G4){$G_4$}; \draw[->](G4)-|(s1); \draw[->]([xshift=2mm]G2.east)|-(G4); \end{tikzpicture} }}} |
[[/smith2_tikz|{{attachment:smith2.png}}]] |
| Line 367: | Line 186: |
| [[attachment:nyquist.pdf|{{attachment:nyquist.png}}|target=blank_]] {{{ \begin{tikzpicture} \small \tikzstyle{block}=[draw,rectangle,minimum size=8mm] \tikzstyle{connector}=[draw,circle,node distance=8mm,inner sep=0mm,minimum size=2mm] \node[block](G2){$G_2$}; \node[draw,rectangle,below of=G2,yshift=-2mm](G3){$G_3$}; \node[coordinate,right of=G2,xshift=4mm](output){}; \draw[->](G2)--node[above,near end](){$Y$}(output); \draw[->]([xshift=4mm]G2.east)|-(G3); \node[connector,left of=G2,xshift=-4mm](o1){}; \draw[->](o1)--(G2); \node[connector,left of=o1,xshift=2mm,yshift=2mm](i1){}; \node[connector,left of=o1,xshift=2mm,yshift=-2mm](i2){}; \draw[-](i1)--(o1); \draw[-](G3)-|node[left,very near end](){$T$}(i2); \node[coordinate,left of=i1](input){}; \draw[-](input)--node[above,near start](){$U$}(i1); \end{tikzpicture} }}} |
[[/nyquist_tikz|{{attachment:nyquist.png}}]] |
| Line 406: | Line 206: |
| [[attachment:statefeed1.pdf|{{attachment:statefeed1.png}}|target=blank_]] {{{ \begin{tikzpicture} \small \tikzstyle{block}=[draw,rectangle,minimum size=8mm] \tikzstyle{sum} = [draw, circle,node distance=8mm,inner sep=0mm,minimum size=4mm] \tikzset{doublearrow/.style={draw,thin,double distance=2pt,->,>=stealth}} \node[block](r){$r$}; \node[coordinate,left of=r,xshift=-2mm](input){$d$}; \draw[->](input)--node[above,near start](){$d$}(r); \node[sum,right of=r,xshift=4mm](s1){$s$}; \draw[->](r)--(s1); \node[block,right of=s1,xshift=12mm](P){$P$}; \draw[->](s1)--node[above,near start](){$b$}(P); \node[coordinate,right of=P,xshift=4mm](output){}; \draw[->](P)--node[above,near end](){$c$}(output); \node[block,below of=P,xshift=-10mm,yshift=-4mm](f){$f$}; \path[doublearrow](P)|-(f); \draw[->](f)-|(s1); \end{tikzpicture} }}} |
[[/statefeed1_tikz|{{attachment:statefeed1.png}}]] |
| Line 431: | Line 211: |
| [[/statefeed4_tikz|{{attachment:statefeed4.png}}]] | |
| Line 433: | Line 214: |
| [[/statefeed5_tikz|{{attachment:statefeed5.png}}]] |
|
| Line 435: | Line 219: |
| [[/statefeed6_tikz|{{attachment:statefeed6.png}}]] |
|
| Line 437: | Line 223: |
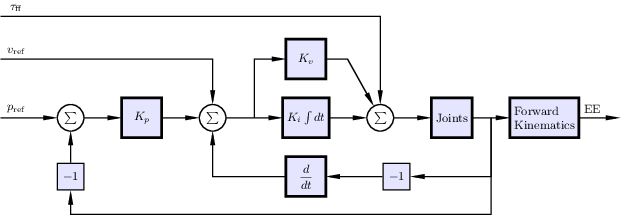
| [[attachment:abbirb.pdf|{{attachment:abbirb.png}}|target=blank_]] {{{ \tikzstyle{block} = [draw, fill=white, rectangle, minimum height=2em, minimum width=4em, align=center] \tikzstyle{sum} = [draw, fill=white, circle] \tikzstyle{input} = [coordinate] %coordinate is used as helper \tikzstyle{output} = [coordinate] \tikzstyle{arrow} = [draw, ->] \def\radius{.9mm} \tikzstyle{s}=[shift={(\radius, 0mm)}] % The block diagram code is probably more verbose than necessary \begin{tikzpicture}[auto, node distance=1.7cm,>=latex'] % We start by placing the blocks \node [input, name=posref] {$q_{ref}$}; \node [input, above=1.2of posref, name=velref] {$\dot{q}_{ref}$}; \node [input, above=1.2of velref, name=trqffw] {$\tau_{ff}$}; \node [sum, right of=posref] (psum) {$\Sigma$}; \node [block, right of=psum] (kp) {$K_p$}; \node [sum, right of=kp] (vsum) {$\Sigma$}; \node [block, right of=vsum] (ki) {$K_i\int{dt}$}; \node [block, above of=ki] (kv) {$K_v$}; \node [sum, right of=ki] (tausum) {$\Sigma$}; \node [block, right of=tausum] (motor) {Joints}; \node [block, right=0.7of motor] (fk) {Forward\\ Kinematics}; \node [output, right=of fk] (output) {$T_S^E$}; \node [block, below of=ki] (pdiff) {$\frac{d}{dt}$}; % Once the nodes are placed, connecting them is easy. \draw [arrow] (posref) node [above right] {$p_{ref}$} -- (psum); \draw [arrow] (velref) node [above right] {$v_{ref}$} -| (vsum.north); \draw [arrow] (trqffw) node [above right] {$\tau_{ff}$} -| (tausum.north); \draw [arrow] (psum) -- node {} (kp); \draw [arrow] (kp) -- node {} (vsum); \draw [arrow] (vsum) -- node {} (ki); \draw [arrow] (ki) -- node {} (tausum); \draw [arrow] (tausum) -- node {} (motor); \draw [arrow] (motor) -- (fk); \draw [arrow] (fk) -- node {$T_{RB}^{TF}$} (output); \draw [arrow] ([xshift=3mm]motor.east) |- node {} (pdiff); \draw [arrow] (pdiff) -| node[pos=0.96, right] {$-$} (vsum.south); \draw [arrow] ([xshift=3mm]vsum.east) |- node [auto] {} (kv); \draw [arrow] (kv) -| node [auto] {} (tausum.north west); \path ([xshift=3mm, yshift=-9mm]motor.east) coordinate (branch); \draw[->] (branch) [shift only] -- ([s]branch -| vsum.south) arc(0:180:\radius) -| node[pos=0.96, right] {$-$} (psum.south); \end{tikzpicture} }}} |
[[/ABBirb_tikz|{{attachment:ABBirb.png}}]] |
Block diagrams in TikZ format
Under Construction
This warning will be removed once all Anton's eps block diagrams have been ported to TikZ. Feel free to contribute. (The existing block diagrams on this page cover all features needed to produce the port the remaining once.)
Background
Anton created a set of block diagrams in ps format, where text elements can be changed using \psfrag in LaTeX. This page provides ports of these block diagrams to TikZ. The reason for creating these ports were:
- The traditional LaTeX compilation, using dvi and ps as middle formats, is widely being replaced with pdflatex and there is no equivalent to psfrag in pdflatex.
- TikZ allows for changes not only of text, but also of the graphics, directly in the .tex document.
Matlab graphics can be exported to TikZ. The format can therefore cater for all graphics needs.
The TikZ code for many of the block diagrams on this page can be made prettier by using e.g. the TikZ calc package, and some additional thinking. Feel free to make improvements where you come across bad programming style. Some of you might also prefer stylistic changes (different line thickness, different aspects of the boxes, etc.), which are easy to introduce in TikZ. If you change the code, please also upload the corresponding pdf and a png copy of it.
Practical
A simple Example
TikZ is a programming language and a TikZ picture is a set of code. The below minimal example shows a .tex document, demonstrating the inclusion of a TikZ block diagram:
\documentclass{pm}
\usepackage{tikz}
\usetikzlibrary{shapes,positioning}
\usetikzlibrary{narrow}

\begin{document}
Figure~\ref{fig:blocks} shows an example block diagram.
\begin{figure}
\centering
%
\begin{tikzpicture}[auto, line width=1pt, >=narrow]
\tikzset{block/.style={draw, rectangle, line width=2pt, minimum height=3em, minimum width=3em, outer sep=0pt}}
\tikzset{sumcircle/.style={draw, circle, outer sep=0pt, label=center:{$\sum$}, minimum width=2em}}

\node[block](G1){$G_1$};
\node[block,below=6mm of G1](G2){$G_2$};
\node[sumcircle,left=7mm of G1](sum){};
\node[coordinate,left=13mm of sum](input){};
\node[coordinate,right=13mm of G1](output){};

\draw[->](input)--node[xshift=-2mm]{$R$}(sum);
\draw[->](sum)--(G1);
\draw[->](G1)--node(y)[]{$Y$}(output);
\draw[->](y)|-(G2){};
\draw[->](G2)-|(sum);
\end{tikzpicture}
\caption{This is a block diagram.\label{fig:blocks}}
\end{figure}
\end{document}
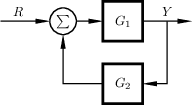
The above code generates a picture that looks like this:
If you think the TikZ code (\begin{tikzpicture to \end{tikzpicture}) clutters the .tex file, it can be placed in a separate file, e,g. mypicture.tikz, and inserted in the .tex file using the the command \input{mypicture.tikz}, which simply places the content of mypicture.tikz at the location of the command.
A further improvement is to use the standalone class and package to create the pictures and to insert them into the main document. All block diagram examples below are created with the standalone class, and the main document to include them would be (same example as above):
\documentclass{pm}
\usepackage{standalone}
\usepackage{tikz}
\usetikzlibrary{shapes,positioning}
\usetikzlibrary{narrow}
\begin{document}
Figure~\ref{fig:blocks} shows an example block diagram.
\begin{figure}
\centering
\input{feedback0.tikz}
\end{figure}
\end{document}
The arrow style >=narrow is local to the department. If you do not have access to it on your computer, you may use >=latex instead, or download the file defining the style; Matlab2tikz/tikzlibrarynarrow.code.tex (or http://dist.control.lth.se/public/Texlive/texmf-local/tex/latex/tikzlibrarynarrow.code.tex ).
Scaling the block diagrams
A simple way to change the size, when including a TikZ picture is to add an extra argument to \begin{tikzpicture}. Here are some examples:
\begin{tikzpicture}[scale=0.6]The above scales edges, but not the nodes, neither text.
\begin{tikzpicture}[scale=0.6, every node/.style={scale=0.6}]The above scales both nodes and edges, but not text.
\begin{tikzpicture}[scale=0.6, transform shape]The above scales everything.
Some people think the default line width is a bit thin. This can easily be changed by adding e.g. thick to the argument list; \begin{tikzpicture}[thick]. (Arguments are comma-separated.)
More info
A lot can be found on online forums. There also exists an extremely well-written (but long!) manual for TikZ and a much more compact minimal introduction.
Note that you can draw almost anything in TikZ, not only block diagrams.
Block diagrams
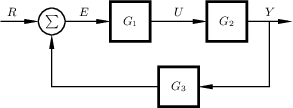
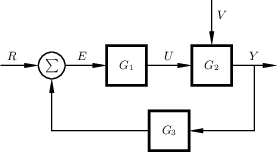
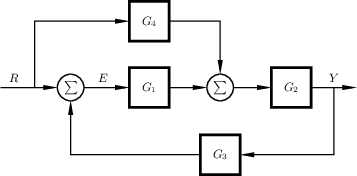
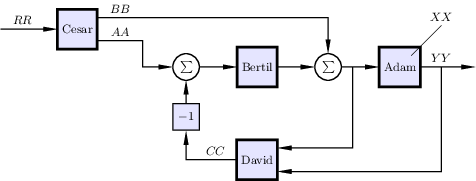
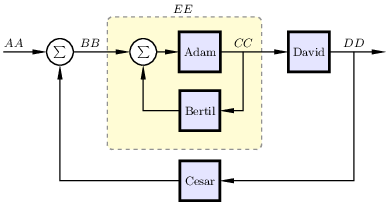
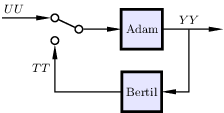
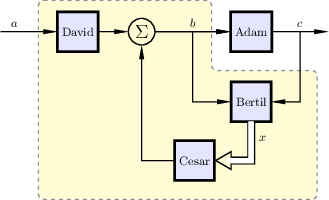
The figures below are links to separate pages with complete source code and some relevant comments for each figure. (They will be, it is still work in progress /Leif)
Feedback systems
feedback0
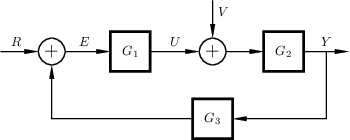
feedback1
feedback1b
feedback1c
feedback1d
feedback1e
feedback2
feedback3
feedback4
feedback5
feedback6
feedback7
feedback8
feedback9
feedback10
feedback11
Other regulator structures
cascade1
cascade2
cascadeff
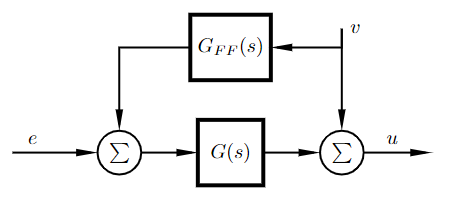
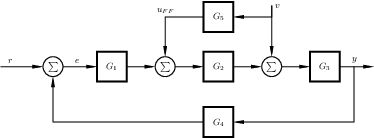
ff0
fbff1
fbff2
fftf
ffss
2DOF
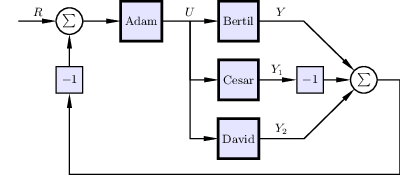
smith1
smith2
Miscellaneous other
parallel
nyquist
openloop1
openloop1b
openloop2
openloop2c
dist1
dist2
dist3
State feedback and observers
statefeed1
statefeed2
statefeed4
statefeed5
statefeed6


