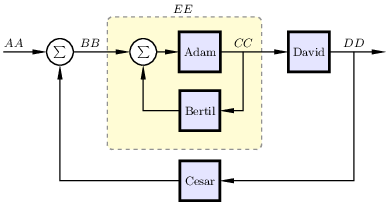
smith2

The yellow background is of course easily changed to something else --- or to nothing. Just change or remove the color options in the background specification.
\documentclass{standalone}
\usepackage[utf8]{inputenc}
\usepackage{amsmath,amsfonts,amssymb}

\usepackage{tikz}
\usetikzlibrary{shapes,positioning,calc}
\usetikzlibrary{narrow}

\tikzset{every picture/.style={auto, line width=1pt, >=narrow,font=\small, x=1mm, y=1mm}}

\tikzset{block/.style={draw, rectangle, line width=2pt, fill=blue!10, minimum height=3em, minimum width=3em, outer sep=0pt}}

\tikzset{blockMinus/.style={draw,minimum width=2em, minimum height=2em,line width=1pt,fill=blue!10,label=center:{$-1$}} }

\tikzset{sumcircle/.style={draw, fill=white, circle, outer sep=0pt,
    label=center:{{$\sum$}}, minimum width=2em}}

% Handle the yellow background
\pgfdeclarelayer{background}
\pgfdeclarelayer{foreground}
\pgfsetlayers{background,main,foreground}


\begin{document}
\begin{tikzpicture}
\node[block](Adam){Adam};
\node[block,below=5mm of Adam](Bertil){Bertil};
\node[block,below=8mm of Bertil](Cesar){Cesar};
\node[sumcircle,left=6mm of Adam](sumA){};
\node[sumcircle,left=15mm of sumA](sumB){};
\node[block,right=18mm of Adam](David){David};
\draw[->](sumB) ++(-15,0)--node[xshift=-3mm]{$AA$}(sumB);
\draw[->](sumB)--node[xshift=-3mm]{$BB$}(sumA);
\draw[->](sumA)--(Adam);
\draw[->](Adam)--node[xshift=-3mm](CC){$CC$}(David);
\draw[->](CC)|-(Bertil);
\draw[->](Bertil)-|(sumA);
\draw[->](David.east)-- node[xshift=-1mm](DD){$DD$}++(15,0);
\draw[->](DD)|-(Cesar);
\draw[->](Cesar)-|(sumB);

% Compute the coordinates for the background and the text above
% the background

\coordinate(b1) at ($(sumA.west |- Adam.north) + (-6,4)$);
\coordinate(b2) at ($(Bertil.south east -| CC.east) +(1,-5)$);
\coordinate(b3) at ($(Adam.north -| CC.east) +(0,4)$);
\node[yshift=6pt] at ($(b1)!0.5!(b3)$) {$EE$};

\begin{pgfonlayer}{background}
  \draw[fill=yellow!20,rounded corners, draw=black!50, dashed, line width=1pt]
  (b1) rectangle(b2);

\end{pgfonlayer}

\end{tikzpicture}
\end{document}
