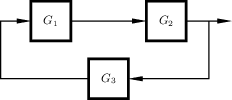
|
Size: 8535
Comment:
|
Size: 11120
Comment:
|
| Deletions are marked like this. | Additions are marked like this. |
| Line 51: | Line 51: |
| {{attachment:feedback0.pdf}} | [[attachment:feedback0.pdf|{{attachment:feedback0.png}}|target=blank_]] |
| Line 55: | Line 55: |
| The arrow style {{{>=narrow}}} is local to the department. If you do not have access to it on your computer, you may use {{{>=latex}}} instead, or download the file defining the style. | The arrow style {{{>=narrow}}} is local to the department. If you do not have access to it on your computer, you may use {{{>=latex}}} instead, or download the file defining the style; [[attachment:Matlab2tikz/tikzlibrarynarrow.code.tex| |&do=get]]. |
| Line 82: | Line 82: |
| {{attachment:feedback0.pdf}} | [[attachment:feedback0.pdf|{{attachment:feedback0.png}}|target=blank_]] |
| Line 102: | Line 102: |
| {{attachment:feedback1.pdf}} | [[attachment:feedback1.pdf|{{attachment:feedback1.png}}|target=blank_]] |
| Line 111: | Line 111: |
| \node[block,below of=U,yshift=10mm](G3){$G3$}; | \node[block,below of=U,yshift=10mm](G3){$G_3$}; |
| Line 123: | Line 123: |
| {{attachment:feedback1b.pdf}} | [[attachment:feedback1b.pdf|{{attachment:feedback1b.png}}|target=blank_]] |
| Line 132: | Line 132: |
| \node[block,below of=U,yshift=10mm](G3){$G3$}; | \node[block,below of=U,yshift=10mm](G3){$G_3$}; |
| Line 146: | Line 146: |
| {{attachment:feedback1c.pdf}} | [[attachment:feedback1c.pdf|{{attachment:feedback1c.png}}|target=blank_]] |
| Line 155: | Line 155: |
| \node[draw,rectangle,below of=U](G3){$G3$}; | \node[draw,rectangle,below of=U](G3){$G_3$}; |
| Line 168: | Line 168: |
| [[attachment:feedback1d.pdf|{{attachment:feedback1d.png}}|target=blank_]] {{{ \begin{tikzpicture} \small \tikzstyle{block} = [draw,rectangle,minimum size=8mm,node distance=25mm] \tikzstyle{sum} = [draw,circle,node distance=8mm,inner sep=0mm,minimum size=4mm] \node[block](G1){$G_1$}; \node[sum,left of=G1,xshift=-4mm](s){$s$}; \node[sum,right of=G1,xshift=4mm](s2){$s$}; \node[block,right of=s2,xshift=-12mm](G2){$G_2$}; \draw[->](G1)--(s2); \draw[->](s2)--(G2); \node[draw,rectangle,below of=s2](G3){$G_3$}; \node[coordinate,left of=s,xshift=-4mm](input){}; \node[coordinate,right of=G2,xshift=6mm](output){}; \draw[->](input)--node[above,near start](){$R$}(s); \draw[->](s)--(G1); \draw[->](G2)--node[above,near end](){$Y$}(output); \draw[->]([xshift=5mm]G2.east)|-(G3); \draw[->](G3)-|(s); \node[block,above of=G1,yshift=-12mm](G4){$G_4$}; \draw[->](G4)-|(s2); \draw[->]([xshift=-4mm]s.west)|-(G4); \end{tikzpicture} }}} |
|
| Line 170: | Line 195: |
| {{attachment:feedback1e.pdf}} | [[attachment:feedback1e.pdf|{{attachment:feedback1e.png}}|target=blank_]] |
| Line 179: | Line 204: |
| \node[block,below of=U,yshift=10mm](G3){$G3$}; | \node[block,below of=U,yshift=10mm](G3){$G_3$}; |
| Line 222: | Line 247: |
| [[attachment:ffss.pdf|{{attachment:ffss.png}}|target=blank_]] {{{ \begin{tikzpicture} \small \tikzstyle{block} = [draw,rectangle,minimum size=8mm,node distance=25mm] \tikzstyle{sum} = [draw, circle,node distance=8mm,inner sep=0mm,minimum size=4mm] \node[draw,rectangle,minimum width=2cm,minimum height=16mm](GM){$G_M$}; \node[coordinate,left of=GM,xshift=-2cm](input){}; \draw[->](input)--node[above,near start](){$R$}(GM); \node[sum,right of=GM,xshift=14mm,yshift=-5mm](s1){$s$}; \draw[->]([yshift=-5mm]GM.east)--node[above](){$X_M$}(s1); \node[block,right of=s1,xshift=-14mm](C){$C$}; \draw[->](s1)--(C); \node[sum,right of=C,xshift=4mm](s2){$s$}; \draw[->](C)--(s2); \draw[->]([yshift=5mm]GM.east)-|node[above](){$U_F$}(s2); \node[block,right of=s2,xshift=-10mm](P){$P$};¶ \draw[->](s2)--(P); \node[coordinate,right of=P,xshift=4mm](output){}; \draw[->](P)--node[above,near end](){$Y$}(output); \node[block,below of=C,yshift=10mm](M){$M$}; \draw[->]([xshift=3mm]s2.east)|-([yshift=2mm]M.east); \draw[->]([xshift=3mm]P.east)|-([yshift=-2mm]M.east); \draw[->](M)-|node[above,near start](){$X_H$}node[left,at end,yshift=-2mm](){$-$}(s1); \draw[-]([xshift=2mm,yshift=2mm]P.center)--node[above, at end,xshift=1mm](){$X$}([xshift=6mm,yshift=8mm]P.center); \end{tikzpicture} }}} |
Block diagrams in TikZ format
Under Construction
This warning will be removed once all Anton's eps block diagrams have been ported to TikZ. Feel free to contribute.
Background
Anton created a set of block diagrams in ps format, where text elements can be changed using \psfrag in latex. This page provides ports of these block diagrams to TikZ. The reason for creating these ports were:
- The traditional latex compilation, using dvi and ps as middle formats, is widely being replaced with pdflatex and there is no equivalent to psfrag in pdflatex.
- TikZ allows for changes not only of text, but also of the graphics, directly in the .tex document.
Matlab graphics can be exported to TikZ. The format can therefore cater for all graphics needs.
Practical
A simple Example
TikZ is a programming language and a TikZ picture is a set of code. The below minimal example shows a .tex document, demonstrating the inclusion of a TikZ block diagram:
\documentclass{pm}
\usepackage{tikz}
\usetikzlibrary{narrow}
\tikzset{>=narrow}
\begin{document}
Figure~\ref{fig:blocks} shows an example block diagram.
\begin{figure}
\centering
%
\begin{tikzpicture}
\small
\tikzstyle{block} = [draw,rectangle,minimum size=8mm,node distance=25mm]
\tikzstyle{sum} = [draw, circle,node distance=8mm,inner sep=0mm,minimum size=4mm]
\node[block](G1){$G_1$};
\node[block,below of=G1,yshift=10mm](G2){$G_2$};
\node[sum,left of=G1,xshift=-3mm](s){$s$};
\node[coordinate,left of=s](input){};
\node[coordinate,right of=G1,xshift=6mm](output){};
\draw[->](input)--node[above,near start](){$R$}(s);
\draw[->](s)--(G1);
\draw[->](G1)--node[above,near end](){$Y$}(output);
\draw[->]([xshift=5mm]G1.east)|-(G2);
\draw[->](G2)-|(s);
\end{tikzpicture}
%
\caption{This is a block diagram.\label{fig:blocks}}
\end{figure}
\end{document}
The above code generates a picture that looks like this:
If you think the TikZ code (\begin{tikzpicture to \end{tikzpicture}) clutters the .tex file, it can be placed in a separate file, e,g. mypicture.tikz, and inserted in the .tex file using the the command \input{mypicture.tikz}, which simply places the content of mypicture.tikz at the location of the commend.
The arrow style >=narrow is local to the department. If you do not have access to it on your computer, you may use >=latex instead, or download the file defining the style; Matlab2tikz/tikzlibrarynarrow.code.tex.
Scaling the block diagrams
A simple way to change the size, when including a TikZ picture is to add an extra argument to \begin{tikzpicture}. Here are some examples:
\begin{tikzpicture}[scale=0.6]The above scales edges, but not the nodes, neither text.
\begin{tikzpicture}[scale=0.6, every node/.style={scale=0.6}]The above scales both nodes and edges, but not text.
Some people think the default line width is a bit thin. This can easily be changed by adding e.g. thick to the argument list; \begin{tikzpicture}[thick]. (Arguments are comma-separated.)
More info
A lot can be found on online forums. There also exists an extremely well-written (but long!) manual for TikZ and a much more compact minimal introduction.
Note that you can draw almost anything in TikZ, not only block diagrams.
Block diagrams
Feedback systems
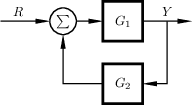
feedback0
\begin{tikzpicture}
\small
\tikzstyle{block} = [draw, rectangle,minimum size=8mm,node distance=25mm]
\tikzstyle{sum} = [draw,circle,node distance=8mm,inner sep=0mm,minimum size=4mm]
\node[block](G1){$G_1$};
\node[block,below of=G1,yshift=10mm](G2){$G_2$};
\node[sum,left of=G1,xshift=-3mm](s){$s$};
\node[coordinate,left of=s](input){};
\node[coordinate,right of=G1,xshift=6mm](output){};
\draw[->](input)--node[above,near start](){$R$}(s);
\draw[->](s)--(G1);
\draw[->](G1)--node[above,near end](){$Y$}(output);
\draw[->]([xshift=5mm]G1.east)|-(G2);
\draw[->](G2)-|(s);
\end{tikzpicture}
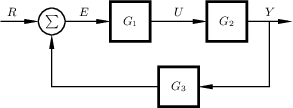
feedback1
\begin{tikzpicture}
\small
\tikzstyle{block} = [draw, rectangle,minimum size=8mm,node distance=25mm]
\tikzstyle{sum} = [draw,circle,node distance=8mm,inner sep=0mm,minimum size=4mm]
\node[block](G1){$G_1$};
\node[block,right of=G1,xshift=-6mm](G2){$G_2$};
\draw[->](G1)--node[above](U){$U$}(G2);
\node[block,below of=U,yshift=10mm](G3){$G_3$};
\node[sum,left of=G1,xshift=-6mm](s){$s$};
\node[coordinate,left of=s](input){};
\node[coordinate,right of=G2,xshift=6mm](output){};
\draw[->](input)--node[above,near start](){$R$}(s);
\draw[->](s)--node[above](){$E$}(G1);
\draw[->](G2)--node[above,near end](){$Y$}(output);
\draw[->]([xshift=5mm]G2.east)|-(G3);
\draw[->](G3)-|(s);
\end{tikzpicture}
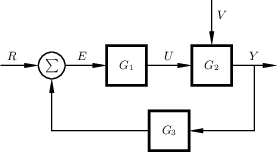
feedback1b
\begin{tikzpicture}
\small
\tikzstyle{block} = [draw, rectangle,minimum size=8mm,node distance=25mm]
\tikzstyle{sum} = [draw,circle,node distance=8mm,inner sep=0mm,minimum size=4mm]
\node[block](G1){$G_1$};
\node[block,right of=G1,xshift=-6mm](G2){$G_2$};
\draw[->](G1)--node[above](U){$U$}(G2);
\node[block,below of=U,yshift=10mm](G3){$G_3$};
\node[sum,left of=G1,xshift=-6mm](s){$s$};
\node[coordinate,left of=s](input){};
\node[coordinate,right of=G2,xshift=6mm](output){};
\draw[->](input)--node[above,near start](){$R$}(s);
\draw[->](s)--node[above](){$E$}(G1);
\draw[->](G2)--node[above,near end](){$Y$}(output);
\draw[->]([xshift=5mm]G2.east)|-(G3);
\draw[->](G3)-|(s);
\node[coordinate,above of=G2,yshift=2mm](input2){};
\draw[->](input2)--node[right,near start](){$V$}(G2);
\end{tikzpicture}
feedback1c
\begin{tikzpicture}
\small
\tikzstyle{block} = [draw,rectangle,minimum size=8mm,node distance=25mm]
\tikzstyle{sum} = [draw,circle,node distance=8mm,inner sep=0mm,minimum size=4mm]
\node[block](G1){$G_1$};
\node[block,right of=G1,xshift=-6mm](G2){$G_2$};
\draw[->](G1)--node[above](U){$U$}(G2);
\node[draw,rectangle,below of=U](G3){$G_3$};
\node[sum,left of=G1,xshift=-6mm](s){$s$};
\node[coordinate,left of=s](input){};
\node[coordinate,right of=G2,xshift=6mm](output){};
\draw[->](input)--node[above,near start](){$R$}(s);
\draw[->](s)--node[above](){$E$}(G1);
\draw[->](G2)--node[above,near end](){$Y$}(output);
\draw[->]([xshift=5mm]G2.east)|-(G3);
\draw[->](G3)-|(s);
\end{tikzpicture}
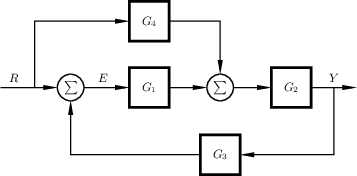
feedback1d
\begin{tikzpicture}
\small
\tikzstyle{block} = [draw,rectangle,minimum size=8mm,node distance=25mm]
\tikzstyle{sum} = [draw,circle,node distance=8mm,inner sep=0mm,minimum size=4mm]
\node[block](G1){$G_1$};
\node[sum,left of=G1,xshift=-4mm](s){$s$};
\node[sum,right of=G1,xshift=4mm](s2){$s$};
\node[block,right of=s2,xshift=-12mm](G2){$G_2$};
\draw[->](G1)--(s2);
\draw[->](s2)--(G2);
\node[draw,rectangle,below of=s2](G3){$G_3$};
\node[coordinate,left of=s,xshift=-4mm](input){};
\node[coordinate,right of=G2,xshift=6mm](output){};
\draw[->](input)--node[above,near start](){$R$}(s);
\draw[->](s)--(G1);
\draw[->](G2)--node[above,near end](){$Y$}(output);
\draw[->]([xshift=5mm]G2.east)|-(G3);
\draw[->](G3)-|(s);
\node[block,above of=G1,yshift=-12mm](G4){$G_4$};
\draw[->](G4)-|(s2);
\draw[->]([xshift=-4mm]s.west)|-(G4);
\end{tikzpicture}
feedback1e
\begin{tikzpicture}
\small
\tikzstyle{block} = [draw, rectangle,minimum size=8mm,node distance=25mm]
\tikzstyle{sum} = [draw,circle,node distance=8mm,inner sep=0mm,minimum size=4mm]
\node[block](G1){$G_1$};
\node[block,right of=G1,xshift=-6mm](G2){$G_2$};
\draw[->](G1)--node[above](U){}(G2);
\node[block,below of=U,yshift=10mm](G3){$G_3$};
\node[coordinate,right of=G2,xshift=6mm](output){};
\draw[->](G2)--node[above,near end](){}(output);
\draw[->]([xshift=5mm]G2.east)|-(G3);
\node[coordinate,left of=G1](turn){};
\draw[->](G3)-|(turn)--(G1);
\end{tikzpicture}
feedback2
feedback3
feedback4
feedback5
feedback6
feedback7
feedback8
feedback9
feedback10
feedback11
Other regulator structures
cascade1
cascade2
cascadeff
fbff1
fbff2
fftf
ffss
\begin{tikzpicture}
\small
\tikzstyle{block} = [draw,rectangle,minimum size=8mm,node distance=25mm]
\tikzstyle{sum} = [draw, circle,node distance=8mm,inner sep=0mm,minimum
size=4mm]
\node[draw,rectangle,minimum width=2cm,minimum height=16mm](GM){$G_M$};
\node[coordinate,left of=GM,xshift=-2cm](input){};
\draw[->](input)--node[above,near start](){$R$}(GM);
\node[sum,right of=GM,xshift=14mm,yshift=-5mm](s1){$s$};
\draw[->]([yshift=-5mm]GM.east)--node[above](){$X_M$}(s1);
\node[block,right of=s1,xshift=-14mm](C){$C$};
\draw[->](s1)--(C);
\node[sum,right of=C,xshift=4mm](s2){$s$};
\draw[->](C)--(s2);
\draw[->]([yshift=5mm]GM.east)-|node[above](){$U_F$}(s2);
\node[block,right of=s2,xshift=-10mm](P){$P$};
\draw[->](s2)--(P);
\node[coordinate,right of=P,xshift=4mm](output){};
\draw[->](P)--node[above,near end](){$Y$}(output);
\node[block,below of=C,yshift=10mm](M){$M$};
\draw[->]([xshift=3mm]s2.east)|-([yshift=2mm]M.east);
\draw[->]([xshift=3mm]P.east)|-([yshift=-2mm]M.east);
\draw[->](M)-|node[above,near start](){$X_H$}node[left,at end,yshift=-2mm](){$-$}(s1);
\draw[-]([xshift=2mm,yshift=2mm]P.center)--node[above, at end,xshift=1mm](){$X$}([xshift=6mm,yshift=8mm]P.center);
\end{tikzpicture}
2DOF
smith1
smith2
Miscellaneous other
parallel
nyquist
openloop1
openloop1b
openloop2
openloop2c
dist1
dist2
dist3
State feedback and observers
statefeed1
statefeed2
statefeed4
statefeed5


