statefeed5

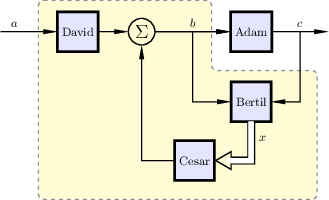
The yellow backgrond is of course only an example and is easily changed to something else, or removed completely. It is specified as fill=yellow!20 inside the background layer specification.
\documentclass{standalone}
\usepackage{tikz}
\usetikzlibrary{shapes,positioning,calc}
\usetikzlibrary{narrow}

% The double arrow comes from
% http://www.texample.net/tikz/examples/double-arrows/
% with modification in
% http://tex.stackexchange.com/questions/169061/tikz-increase-arrow-head-size
\usetikzlibrary{arrows,decorations.markings}

\tikzset{block/.style={draw, rectangle, line width=2pt,
    fill=blue!10, minimum height=3em, minimum width=3em,
     outer sep=0pt}}
\tikzset{sumcircle/.style={draw, circle, outer sep=0pt,
      label=center:{{\Large$\Sigma$}}, minimum width=2em}}
\tikzset{vecArrow/.style={
  line width=1pt,
  decoration={
    markings,mark=at position 1 with {
       \arrow[scale=2.5,line width=0.4pt] {open triangle 60}
    }
  },
  double distance=4pt, shorten >= 13pt,
  preaction = {decorate},
  postaction = {draw,line width=4pt, white,shorten >= 10pt}
}}
\tikzset{innerWhite/.style={semithick, white, line width=1.4pt,
     shorten >= 4.5pt}}

\tikzset{every picture/.style={auto, line width=1pt, >=narrow,
    x=1mm, y=1mm, font=\small}}

% Handle the yellow background
\pgfdeclarelayer{background}
\pgfdeclarelayer{foreground}
\pgfsetlayers{background,main,foreground}

\begin{document}
\begin{tikzpicture} %[auto, line width=1pt, >=narrow, x=1mm,y=1mm]
\node[sumcircle](sumA){};
\node[block, right=20mm of sumA](Adam){Adam};
\coordinate[right=15mm of Adam](output);
\node[block,below=8mm of Adam](Bertil){Bertil};
\node[block,below=5mm of Bertil,xshift=-15mm](Cesar){Cesar};
\node[block,left=8mm of sumA](David){David};
\coordinate[left=15mm of David](input);
\draw[->](input)--node[xshift=-4mm]{$a$}(David);
\draw[->](David)--(sumA);
\draw[->](sumA)--(Adam);
\draw[->](sumA)--node(forkB){$b$}(Adam);
\draw[->](Adam)--node(forkC){$c$}(output);
\draw[->](forkC)|-(Bertil);
\draw[->](forkB)|-(Bertil);
\draw[vecArrow](Bertil)|-node[xshift=3mm,yshift=8mm]{$x$}(Cesar);
\draw[->](Cesar)-|(sumA);

\begin{pgfonlayer}{background}
    \coordinate(a1) at ($(David.west |- David.north) + (-5,3)$);
    \coordinate(a2) at ($(Adam.west|-a1) + (-5,0)$);
    \coordinate (a3) at ($(a2|-Adam.south) + (0,-5)$);
    \coordinate (a4) at ($(a3 -| Adam.east) + (12,0)$);
    \coordinate (a5) at ($(a4|-Cesar.south) + (0,-5)$);
    \coordinate(a6) at (a5-|a1);
  \path[fill=yellow!20,rounded corners, draw=black!50, dashed, line width=1pt]
  (a1)--(a2)--(a3) -- (a4) --(a5) -- (a6)-- cycle;
\end{pgfonlayer}
\end{tikzpicture}
\end{document}