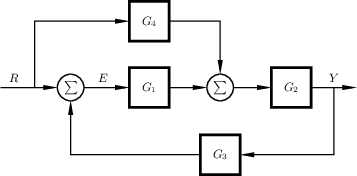
feedback1d

\documentclass{standalone}
\usepackage{tikz}
\usetikzlibrary{shapes,positioning}
\usetikzlibrary{narrow}

\tikzset{block/.style={draw, rectangle, line width=2pt,
     minimum height=3em, minimum width=3em, outer sep=0pt}}
\tikzset{sumcircle/.style={draw, circle, outer sep=0pt,
     label=center:{{$\sum$}}, minimum width=2em}}
\tikzset{every picture/.style={auto, line width=1pt,
          >=narrow,font=\small}}

\begin{document}
\begin{tikzpicture}
\node[block](G1){$G_1$};
\node[block,above=7 mm of G1](G4){$G_4$};
\node[sumcircle,right=10mm of G1](sum2){};
\node[block,right=10mm of sum2](G2){$G_2$};
\node[block,below=9mm of sum2](G3){$G_3$};
\node[sumcircle,left=12mm of G1](sum){};
\node[coordinate, left=15mm of sum](ref){};
\node[coordinate, left=6mm of sum](fork){};

\draw[->](ref)--node[xshift=-4mm](){$R$}(sum);
\draw[->](sum)--node[xshift=-1mm](){$E$}(G1);
\draw[->](G1)--(sum2);
\draw[->](sum2)--(G2);
\draw[->](fork)|-(G4);
\draw[->](G4)-|(sum2);
\node[coordinate, right=12mm of G2](output){};
\draw[->](G2)--node[xshift=0mm](Y){$Y$}(output);
\draw[->](Y)|-(G3);
\draw[->](G3)-|(sum);
\end{tikzpicture}
\end{document}